The Analytics Suite Built for Publishers
Monitor website speed, maximize ad revenue, optimize Prebid.js, and track content performance — all from one real-time dashboard.
Real User Monitoring
Track page load speed, DNS, TTFB, FCP, and memory usage from real visitors across every device and geography.
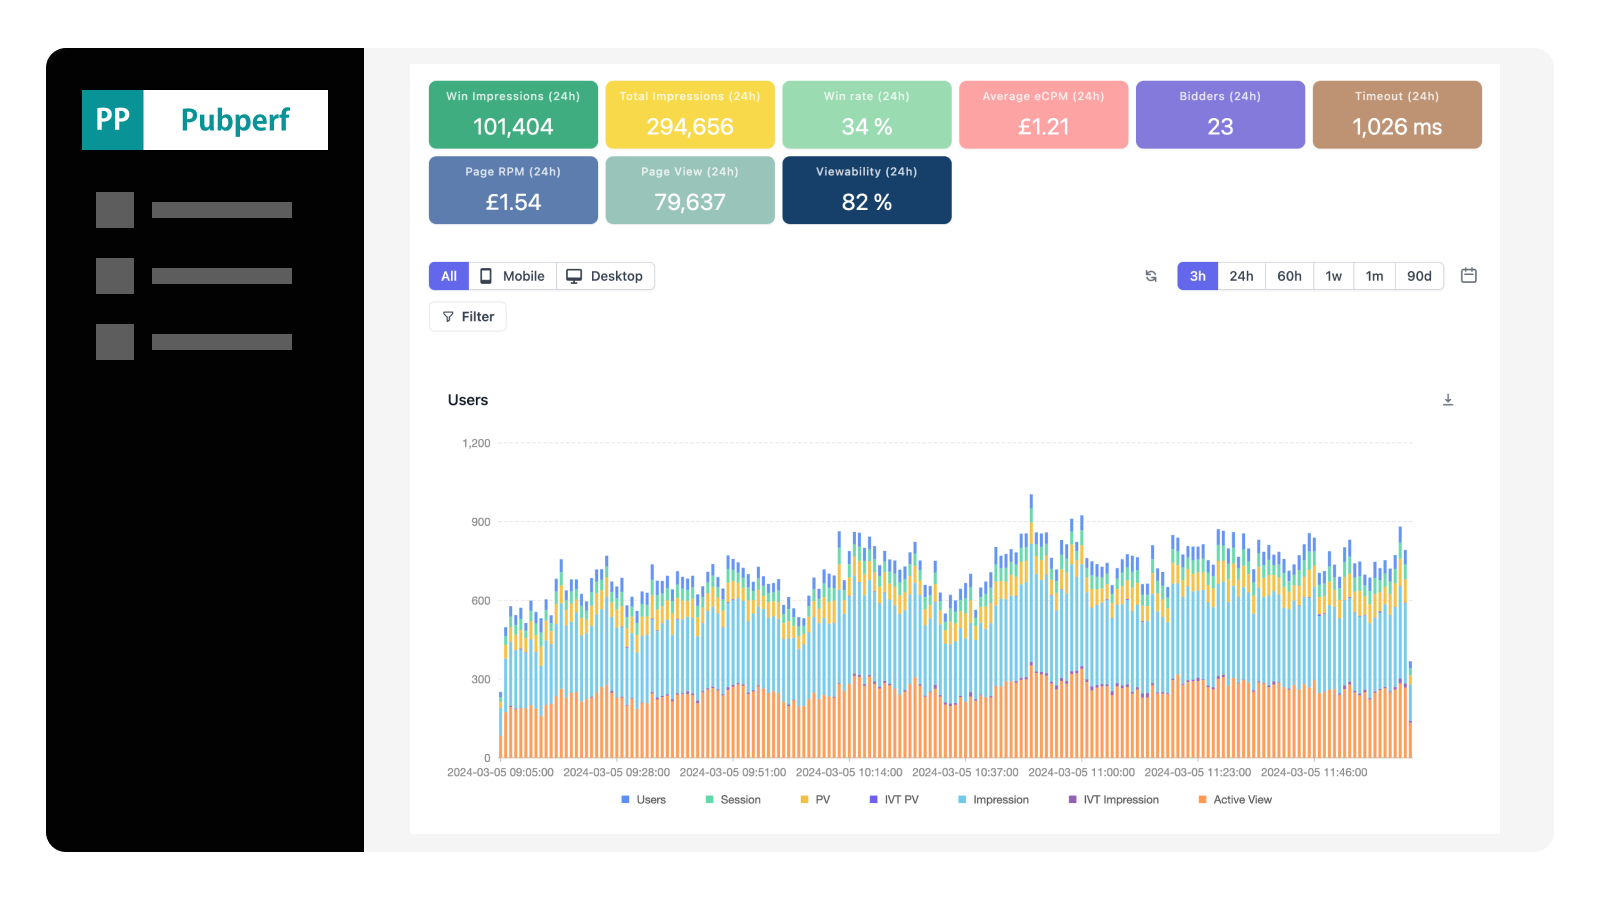
Ad Revenue Analytics
Monitor impressions, viewability, CPM, and revenue in real time. Spot drops before they impact your bottom line.
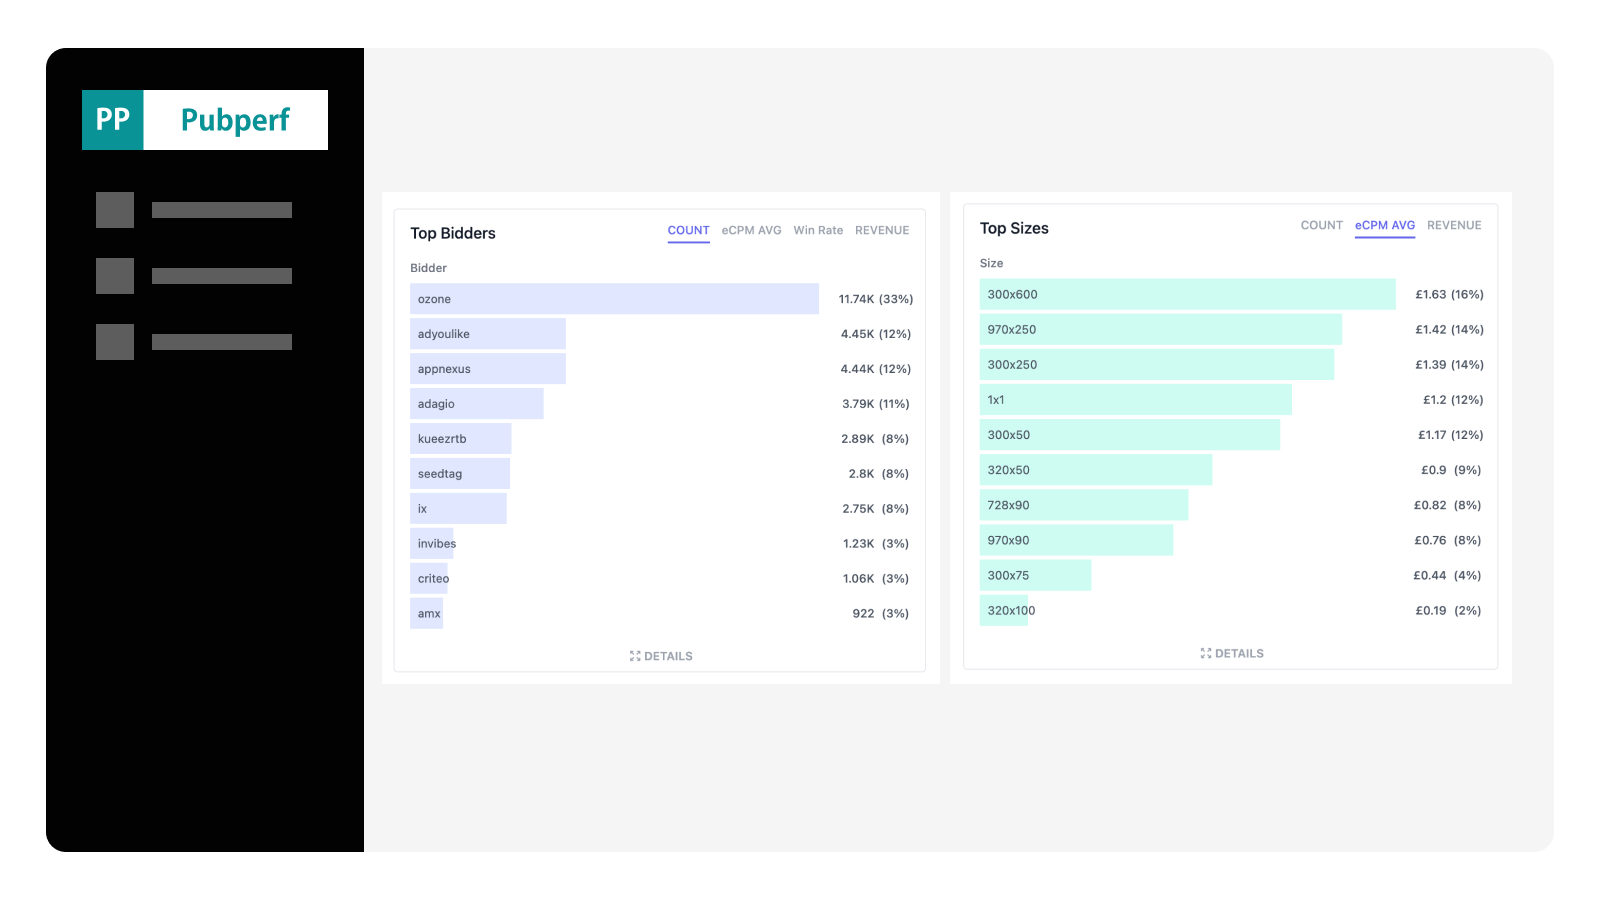
Real-Time Prebid.js Analytics
Track bid rates, timeouts, latency, eCPM, and win rates per bidder to prevent revenue loss and optimize yield.
Content Performance Analytics
Analyze traffic and engagement by author, category, URL, and contextual signals to optimize your content strategy.

Ad Revenue Analytics Report
Near real-time dashboards updated without day-long delays. See impressions, revenue, and eCPM as they happen.
Gain insight into top bidders, top countries, top ad sizes, and top brands buying your inventory.

Realtime Content Analytics Report
Break down performance by author, category, URL, and contextual segments. Identify top-growing pages and top referrers to double down on what works.

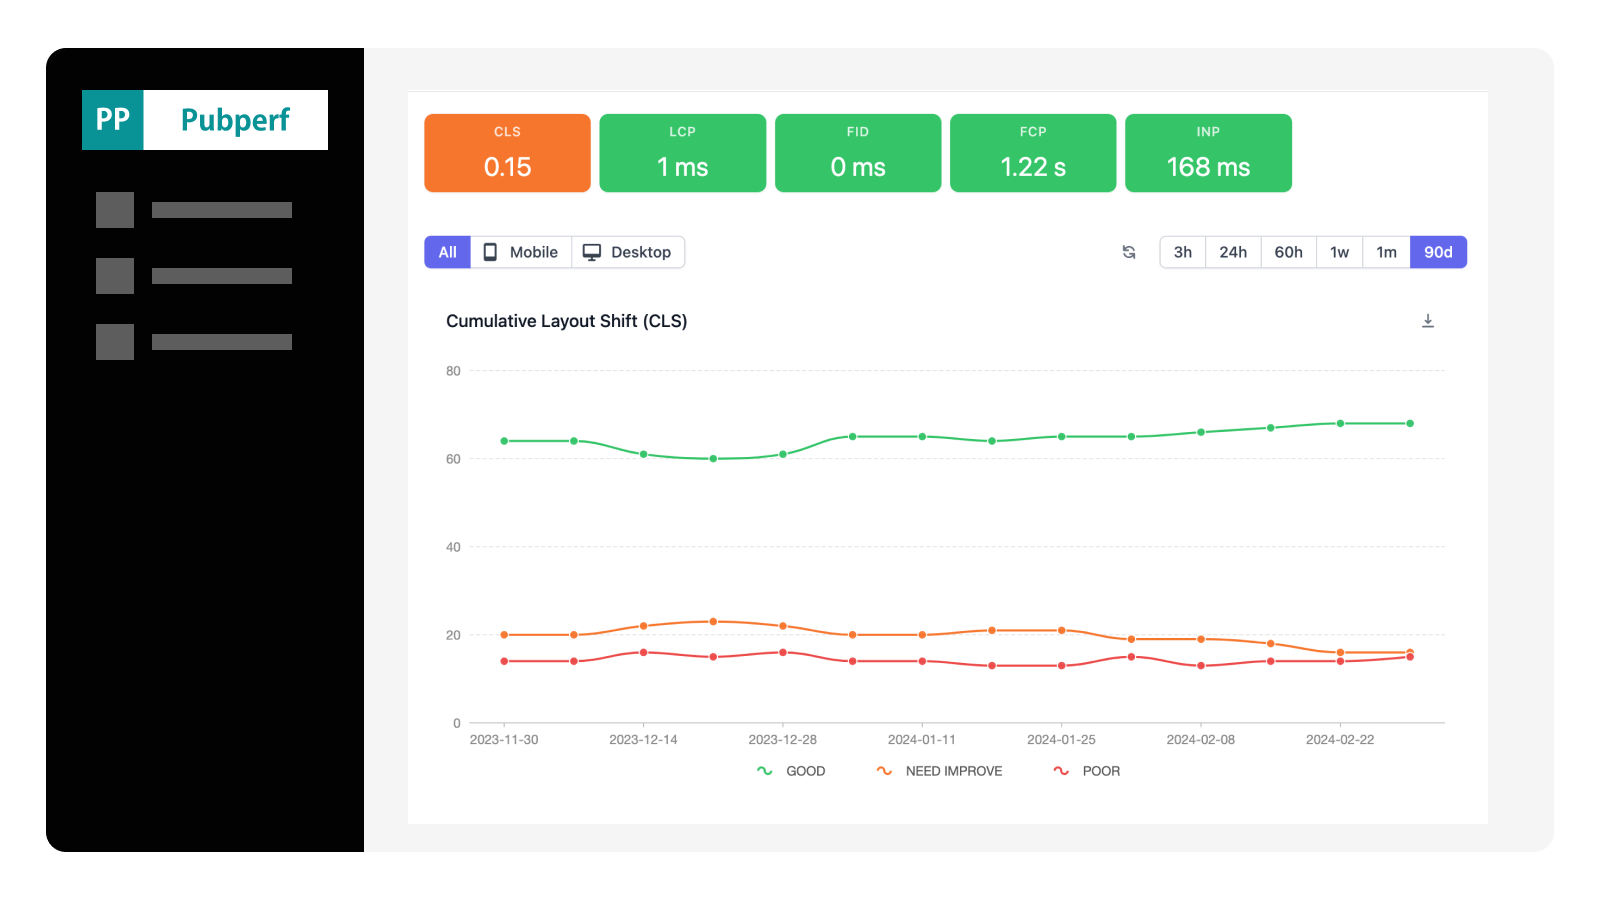
Core Web Vitals Monitoring
Track LCP, CLS, INP, and FID from real users on both mobile and desktop. Protect your SEO rankings and ad revenue with continuous monitoring.
Revenue Forecasting
Predict revenue trends and traffic volume with built-in forecasting to plan ahead with confidence.
Alerts and Notifications
Set thresholds for performance metrics, Web Vitals, and revenue. Get email alerts when something needs attention.
Diagnose Issues Fast
When your site slows down or revenue drops, drill into the data by device, geography, and page to find the root cause.

Web Vitals Distribution Analysis
See the distribution of Good, Needs Improvement, and Poor scores across all Core Web Vitals. Identify your worst-performing pages and track improvements over time.
Global Audience Insights
Segment performance by country and region. See how your site performs for visitors worldwide.
Mobile and Desktop
Compare mobile vs desktop performance side by side. Filter every report by device type.
Flexible Time Ranges
Analyze data across time ranges from 3 hours to 1 year. Detect changes with hourly resolution.
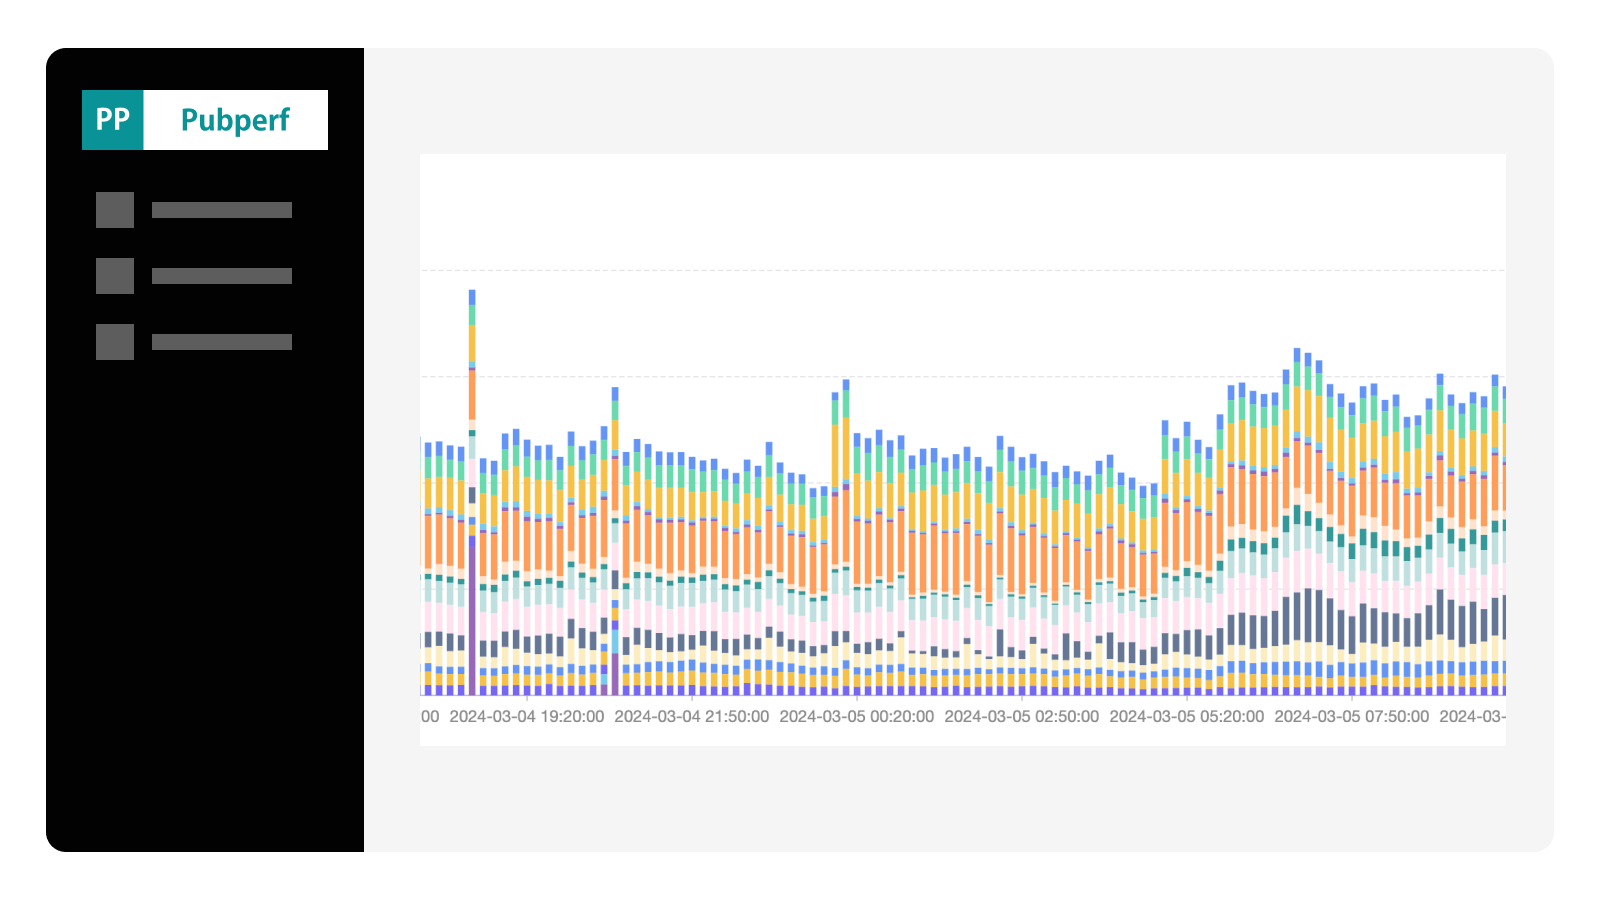
Performance Trend Analysis
Track how every change to your site impacts performance. Correlate deployments, ad configuration changes, and third-party updates with real user metrics.
PubPerf Resources
Insights and guides for publishers

Introducing PubPerf MCP: Query Your Analytics with AI
Header Bidding Analytics: What to Track and Why It Matters
The Complete Guide to Prebid Analytics Tools: 2026 Comparison
How Ads Affect Core Web Vitals: A Data-Driven Publisher Guide
Why Your Ad Revenue Dropped: A Publisher's Diagnostic Guide

How to Improve Web Vitals INP Score and Identify issues