The Complete Guide to Prebid Analytics Tools: 2026 Comparison
Transfon Team
9 min read
Header bidding generates meaningful revenue for digital publishers, but without proper analytics you're flying blind. A misconfigured bidder, a spike in timeouts, or a consent management issue can silently drain thousands of dollars before anyone notices. This guide compares the leading prebid analytics solutions and shows you exactly what to track.
Why Prebid Analytics Matters in 2026
The header bidding network has matured noticeably. Most top publishers run Prebid.js with multiple demand partners competing for every impression. The complexity of managing 5, 10, or even 20+ bidders across multiple ad slots means that problems are inevitable — and invisible without proper header bidding analytics.
Consider what happens without analytics: a bidder adapter breaks after a Prebid.js version update, and no one notices for three days. A consent management platform update silently blocks bid requests to half your demand partners. Your timeout settings are too aggressive, cutting off high-value bids before they arrive. Each of these scenarios costs real revenue, and each is trivially detectable with proper analytics in place.
The shift to real-time analytics has been notably important. Traditional approaches — pulling reports from your ad server the next day, or checking weekly revenue summaries — create dangerous blind spots. By the time you spot a problem in yesterday's report, it's already cost you a full day of revenue. Real-time analytics tools like Pubperf give publishers the ability to detect and diagnose issues within minutes.
Central Metrics Every Publisher Should Track
Before comparing tools, you need to understand what metrics actually matter for header bidding performance. Not all analytics platforms track the same things, and the metrics you prioritize should drive your tool selection.
Bid Rate and Win Rate
Bid rate measures the percentage of auction requests that return a bid from a given demand partner. Win rate measures how often that bidder's bid is the highest and wins the auction. Together, these two metrics tell you whether a bidder is actively participating and competitive.
A healthy bidder should have a bid rate above 60-70% and a win rate that reflects its competitive position. If a bidder's bid rate suddenly drops from 80% to 20%, something is wrong — likely a configuration issue, an adapter error, or a consent problem. If a bidder has a high bid rate but near-zero win rate, their bids are consistently too low or your floor prices are too high.
eCPM by Bidder
Average eCPM across all bidders is a vanity metric. What matters is the winning eCPM per bidder — what each demand partner actually pays when they win an auction. This tells you which bidders bring the most value per impression.
Be cautious about bidders that bid high but rarely win. A bidder with a $5 eCPM but a 2% win rate contributes far less revenue than one with a $2 eCPM and a 25% win rate. Pubperf's real-time eCPM tracking lets you see these patterns as they develop, not after the fact.
Timeout Rate and Bidder Latency
Every header bidding setup has a timeout — typically 1,000 to 3,000 milliseconds — after which the auction closes regardless of whether all bidders have responded. Bidders that consistently time out are costing you revenue (their bids never compete) and slowing down your page (the auction waits for the full timeout before proceeding).
Tracking timeout rate per bidder is critical. If a bidder times out on more than 5-10% of auctions, you have three options: increase your global timeout (which slows the page for everyone), remove the bidder (which reduces competition), or work with the bidder to improve their response time. Real-time latency data helps you make this decision based on evidence rather than guesswork.
Revenue by Geography, Device, and Ad Size
Not all impressions are equal. Revenue varies dramatically by geography (US/UK traffic is worth 3-5x more than Southeast Asian traffic), device type (desktop typically outperforms mobile), and ad size (300x250 and 728x90 command higher eCPMs than less standard sizes).
Dimensional analysis helps you identify where revenue is growing or declining. A revenue drop might be caused not by a technical issue, but by a shift in your traffic mix — more mobile traffic from a viral social post, for example, can lower your blended eCPM even while everything is working correctly.
Error Rate
Errors in the header bidding stack are more common than most publishers realize. GDPR consent signals not reaching bidders, malformed bid requests, adapter initialization failures, and network timeouts all reduce revenue silently. Tracking error rates per bidder helps you catch these issues before they compound.
Comparison of Prebid Analytics Approaches
There are basically four approaches publishers use today to track header bidding performance. Each has distinct strengths and limitations.
Pubperf: Purpose-Built Real-Time Prebid Analytics
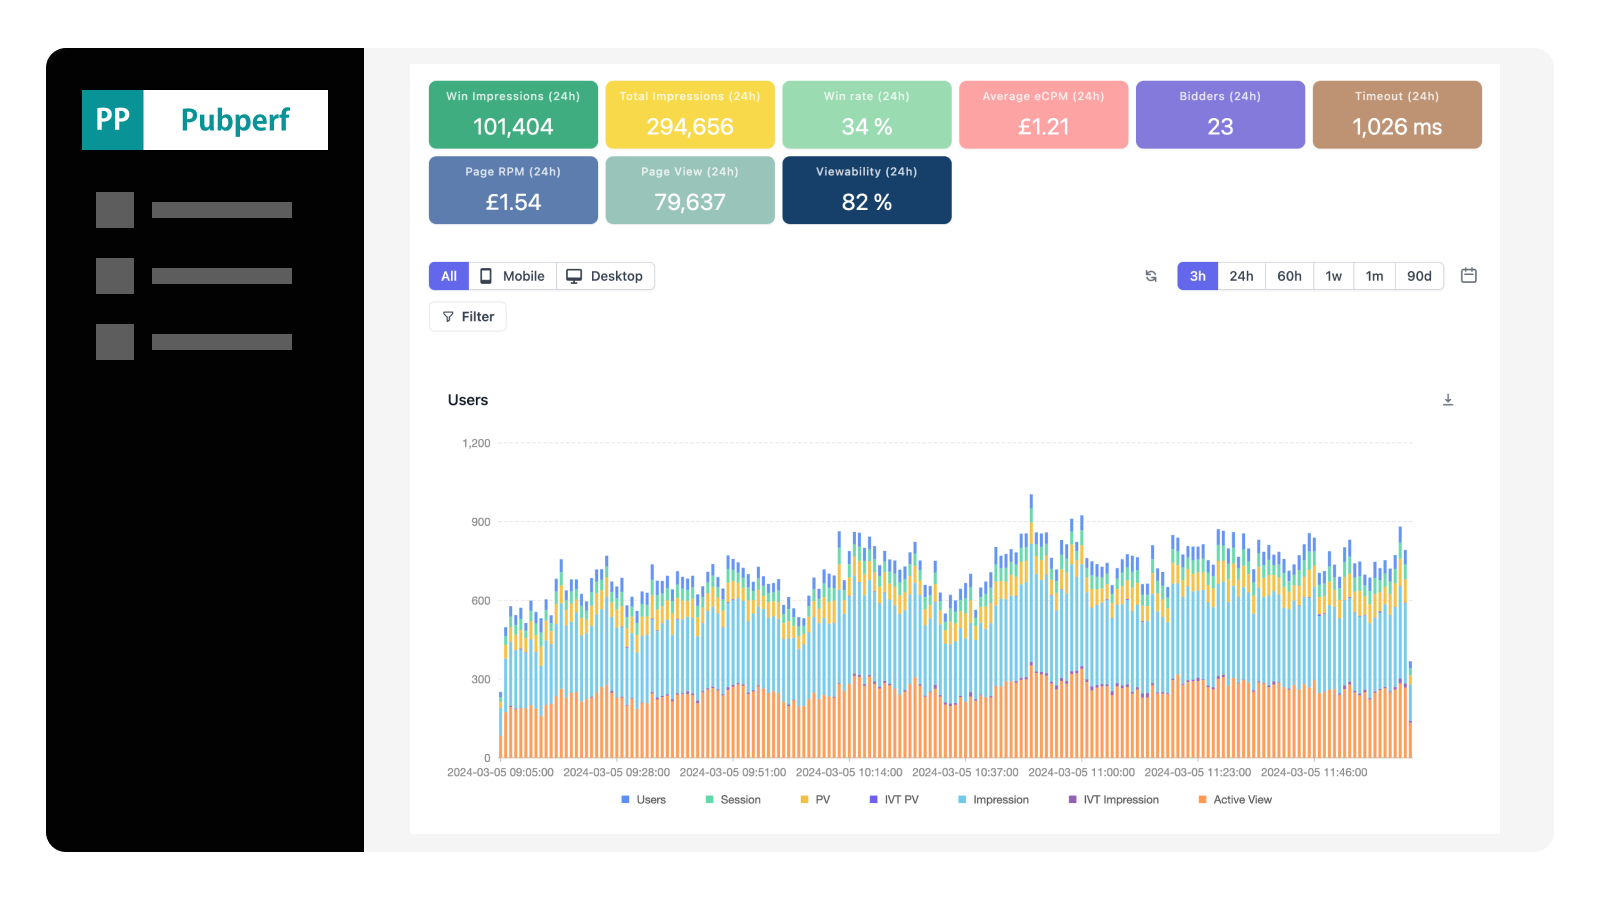
Pubperf is a dedicated analytics platform built specifically for publishers running header bidding. It provides real-time visibility into every aspect of the prebid auction lifecycle with 10-minute granularity.
What sets Pubperf apart:
- Real-time monitoring: See bidder performance, timeouts, eCPM trends, and errors as they happen — not the next day
- No sampling: Every auction is captured, giving you accurate data even for low-traffic ad slots or geographies
- Integrated performance monitoring: Pubperf uniquely combines prebid analytics with Core Web Vitals monitoring and page speed tracking, letting you see how ad configuration changes affect site performance
- Bidder latency tracking: Per-bidder response time data helps you make better timeout settings based on evidence
- Alerting: Get notified when central metrics deviate from your baselines, so problems are caught early
The integration between header bidding analytics and site performance data is in particular useful. When you adjust your prebid timeout from 2,000ms to 1,500ms, Pubperf shows you both the revenue impact (fewer bids captured) and the performance impact (faster page loads) — letting you find the optimal balance.
Prebid.js Built-in Analytics Adapters
Prebid.org documents over 50 analytics adapters that plug directly into the Prebid.js framework. These include adapters for Google Analytics, a range of ad server platforms, and specialized analytics providers. The official Prebid.js analytics module fires events for auction init, bid requested, bid response, bid won, and other lifecycle stages.
Strengths:
- Free (for the adapter itself)
- Tight integration with the Prebid.js event system
- Many options to choose from
Limitations:
- Most adapters require significant setup and configuration
- Data quality depends on how the adapter is implemented
- Many adapters send data to platforms not designed for prebid analysis (e.g., Google Analytics), making it difficult to extract meaningful insights
- No built-in alerting or anomaly detection
- Performance data is typically not correlated with page speed or user experience metrics
Google Ad Manager Reports
Many publishers rely on their ad server (typically Google Ad Manager) for revenue reporting. GAM provides aggregate revenue data by ad unit, advertiser, geography, and other dimensions.
Strengths:
- Already in place for most publishers
- Definitive source of truth for revenue
- Good historical reporting
Limitations:
- Not real-time — reports are delayed by several hours to a full day
- No visibility into the bidding funnel (only winning bids appear)
- No bidder latency, timeout, or error data
- Can't diagnose why revenue changed — only that it did
- No connection to page performance metrics
Custom In-House Solutions
Larger publishers sometimes build custom analytics pipelines using Prebid.js event handlers, server-side data collection, and visualization tools like Grafana or Looker.
Strengths:
- Complete flexibility and customization
- Can be tailored to specific business needs
- Full data ownership
Limitations:
- High engineering cost to build and maintain (typically requires 1-2 dedicated engineers)
- Need to build data pipeline, storage, dashboards, and alerting from scratch
- Ongoing maintenance burden as Prebid.js evolves
- Often lacks the specialized ad tech context that purpose-built tools provide
- Time to value is measured in months, not days
How to Evaluate a Prebid Analytics Platform
When evaluating prebid analytics tools, use this checklist:
Data quality and coverage:
- Does it capture all auctions or use sampling?
- What granularity is available (real-time, hourly, daily)?
- Can you drill down by bidder, ad slot, geography, device, and ad size?
Real-time capability:
- How quickly is data available after an auction occurs?
- Can you set up real-time alerts for anomalies?
- Is there a live dashboard for at-a-glance monitoring?
Integration depth:
- How does it integrate with Prebid.js (analytics adapter, script tag, server-side)?
- Does it work with your consent management platform?
- Can it correlate ad data with page performance metrics?
Actionability:
- Does it provide recommendations, or just raw data?
- Can you easily compare bidder performance side by side?
- Does it help you optimize timeout settings and floor prices?
Operational:
- What's the setup time and complexity?
- What's the performance impact on page load?
- How is pricing structured?
Getting Started with Prebid Analytics
If you are running header bidding without analytics — or relying solely on ad server reports — you're almost certainly leaving revenue on the table. Here's how to get started:
Week 1: Instrument and collect baseline data. Set up your analytics tool and let it collect data for at least one full week. Resist the urge to make changes until you have a baseline.
Week 2: Identify your top issues. Look for bidders with high timeout rates, unexplained bid rate drops, or latency that consistently approaches your timeout threshold. These are your quick wins.
Week 3: Sharpen and measure. Make one change at a time — adjust a timeout, remove an underperforming bidder, update floor prices — and measure the impact. The key is controlled changes with measured outcomes.
Ongoing: Monitor and alert. Set up alerts for revenue drops, timeout spikes, and error rate increases. The goal is to catch problems in minutes, not days. Review bidder performance weekly and make evidence-based optimization decisions. If revenue does drop unexpectedly, follow our diagnostic framework for ad revenue drops to identify the root cause quickly.
The publishers who treat header bidding as an active, numbers-backed practice consistently outperform those who set it up and forget it. Analytics is the difference between the two approaches.
Stop guessing about your header bidding performance. Pubperf gives you real-time visibility into every bidder, every auction, and every dollar — so you can improve with confidence.