Header Bidding Analytics: What to Track and Why It Matters
Transfon Team
10 min read
Header bidding transformed programmatic advertising by letting publishers auction inventory to multiple demand sources simultaneously, breaking the waterfall model that gave preferential access to a single ad exchange. But running header bidding without analytics is like driving without a dashboard — you know you are moving, but you have no idea how fast, how efficiently, or whether something is about to break. This guide covers everything you need to track and why it matters for your bottom line.
What's Header Bidding Analytics?
Header bidding analytics is the measurement and analysis of the full auction lifecycle: from the moment a bid request fires on a user's page load to the final rendered ad impression and the revenue it generates. It goes far beyond what your ad server reports — it captures the bidding process itself, including which bidders responded, how quickly, at what prices, and who won.
Basic ad server reports (like those from Google Ad Manager) tell you what happened to your revenue. Header bidding analytics tells you why it happened. When revenue drops 15% on a Tuesday morning, your ad server shows the decline but can't explain it. Header bidding analytics shows you that a specific bidder stopped responding, or that your timeout rate spiked, or that a consent management update blocked bid requests to European demand partners.
The shift from reactive to proactive management is what separates publishers who consistently grow their programmatic revenue from those who ride a rollercoaster of unexplained ups and downs.
The Header Bidding Analytics Funnel
Every header bidding auction follows a predictable funnel. Understanding each stage — and the metrics that matter at each stage — is necessary for effective optimization.
Stage 1: Bid Requests
The auction begins when Prebid.js fires bid requests to your configured demand partners. At this stage, the important question is: are all bidders receiving requests?
Metrics to track:
- Total auction volume: How many auctions are running per page load and per session
- Request rate by bidder: Is each bidder receiving the expected number of requests?
- Request errors: Are any requests failing before they even reach the demand partner?
Common issues at this stage:
- Consent management errors silently blocking requests to some bidders (especially common after CMP updates)
- Geographic restrictions preventing bidders from receiving requests in certain regions
- Ad blocker interference reducing the number of auctions reaching demand partners
- Prebid.js configuration errors causing some adapters to not initialize
Stage 2: Bid Responses
After receiving requests, demand partners evaluate the impression opportunity and decide whether to bid and at what price. This is where bidder performance becomes measurable.
Metrics to track:
- Bid rate: The percentage of requests that return a bid (target: 60-80% for healthy bidders)
- Response latency: How long each bidder takes to respond in milliseconds
- Timeout rate: The percentage of bid requests that don't receive a response before the auction timeout
- Bid price distribution: The range and average of bid prices from each partner
Common issues at this stage:
- High timeout rates indicating bidder infrastructure problems or timeout settings that are too aggressive
- Sudden bid rate drops suggesting adapter compatibility issues or demand partner policy changes
- Latency spikes during peak traffic periods when demand partner servers are under load
Stage 3: Auction Winners
Once all bids are collected (or the timeout expires), Prebid.js selects the highest bid and passes it to the ad server for final selection. At this stage, you are measuring competitive dynamics.
Metrics to track:
- Win rate by bidder: How often each demand partner's bid is the highest
- Winning eCPM by bidder: The average price paid by each bidder when they win
- Winning eCPM by dimension: Geo, device type, ad size, and ad slot breakdowns
- Bid density: Average number of competing bids per auction (more is better)
What to look for:
- A single bidder winning more than 50% of auctions may indicate insufficient competition
- Win rate changes over time signal shifts in demand partner strategy or budget allocation
- Low bid density (fewer than 3 competing bids per auction) suggests you need more demand partners or need to investigate why existing partners are not bidding
Stage 4: Rendered Impressions
Winning the auction is not the end of the story. The winning creative must actually render in the user's browser and be viewable for the publisher to earn revenue.
Metrics to track:
- Win-to-render rate: The percentage of auction wins that result in a rendered ad
- Viewability rate: The percentage of rendered ads that meet viewability thresholds (typically 50% of pixels visible for 1+ second)
- Revenue reconciliation: Comparing analytics-reported wins to ad server-reported revenue
A major gap between auction wins and rendered impressions indicates technical problems — creative rendering failures, ad slot visibility issues, or user navigation away from the page before the ad loads.
Main KPIs for Header Bidding
Revenue KPIs
These are the bottom-line metrics that directly reflect your monetization performance:
- Total header bidding revenue: Absolute revenue and its percentage of total programmatic revenue
- Revenue per session (RPS): Total revenue divided by total user sessions — a better metric than RPM because it accounts for pageviews per session and ad density
- eCPM trends: Daily and hourly eCPM patterns — understanding your normal rhythms helps you spot anomalies faster
- Revenue by demand partner: Which bidders contribute the most revenue, and how's that distribution changing?
Performance KPIs
These metrics measure the health and efficiency of your header bidding implementation:
- Average bidder latency: Target under 500ms for most bidders; anything consistently above 1,000ms is a problem
- Timeout rate by bidder: Target under 5%; consistently above 10% warrants investigation or bidder removal
- Bid density: Average number of bids per auction — target 3-5 competing bids for healthy competition
- Auction completion time: How long the entire auction process takes from request to winner selection
Health KPIs
These metrics indicate whether your header bidding infrastructure is functioning correctly:
- Error rate by bidder: Adapter errors, network failures, and malformed responses
- Consent pass-through rate: Percentage of auctions where valid consent signals reach all bidders
- Adapter initialization success rate: Whether all configured bidders are loading and initializing correctly
- Page coverage: Percentage of pageviews where header bidding successfully runs (should be 95%+)
Common Header Bidding Issues (and How to Spot Them)
Revenue Suddenly Drops
A sudden revenue decline is the most alarming scenario, and the most common reason publishers start looking for analytics tools. The diagnostic process follows a systematic framework:
- Check if traffic dropped — Revenue decline may be driven by fewer impressions, not lower eCPMs
- Check bidder participation — Is a specific bidder's bid rate or win rate down?
- Check for errors — Did a CMP update, Prebid.js upgrade, or site change break something?
- Check for timeout spikes — Are bidders taking longer to respond, missing the auction window?
With real-time analytics from Pubperf, you can diagnose most revenue drops within minutes by checking the prebid analytics dashboard and correlating the timing of the drop with changes in specific metrics.
For a complete diagnostic framework, see our guide: Why Your Ad Revenue Dropped: A Publisher's Diagnostic Guide.
One Bidder Dominates All Auctions
Healthy header bidding requires competition. If one bidder wins 60-70%+ of auctions, it usually means:
- Other bidders are timing out (check timeout rates)
- Other bidders have stopped bidding (check bid rates)
- Floor prices are set incorrectly, excluding mid-range bids
- The dominant bidder has exclusive or preferential access to high-value demand
Use bidder-level win rate and eCPM data to understand whether the dominant bidder is actually delivering the highest value or simply winning by default because competitors aren't participating.
High Bid Rate but Low Win Rate
When a bidder consistently bids but rarely wins, something is off:
- Floor prices too high: The bidder's bids are competitive but below your floor price threshold
- Ad server line item priority: Your ad server may be preferring direct-sold or guaranteed campaigns over header bidding
- Bid price discrepancy: The bidder is bidding at or near the minimum, not competitively
Examining bid price distributions alongside win rates helps identify whether the issue is with the bidder's pricing or with your configuration.
Slow Page Load After Adding a Bidder
When adding a new demand partner causes noticeable performance degradation, you need to measure the trade-off between the additional revenue and the performance cost. See our detailed guide on how ads affect Core Web Vitals for strategies to minimize the impact.
Main metrics to check:
- Does the new bidder's adapter add significant JavaScript bundle size?
- Does the new bidder consistently respond near or after the timeout threshold?
- Is the new bidder causing Long Tasks that degrade INP scores?
How Pubperf Tracks Header Bidding
Pubperf's prebid analytics platform provides comprehensive visibility into every aspect of the header bidding lifecycle:
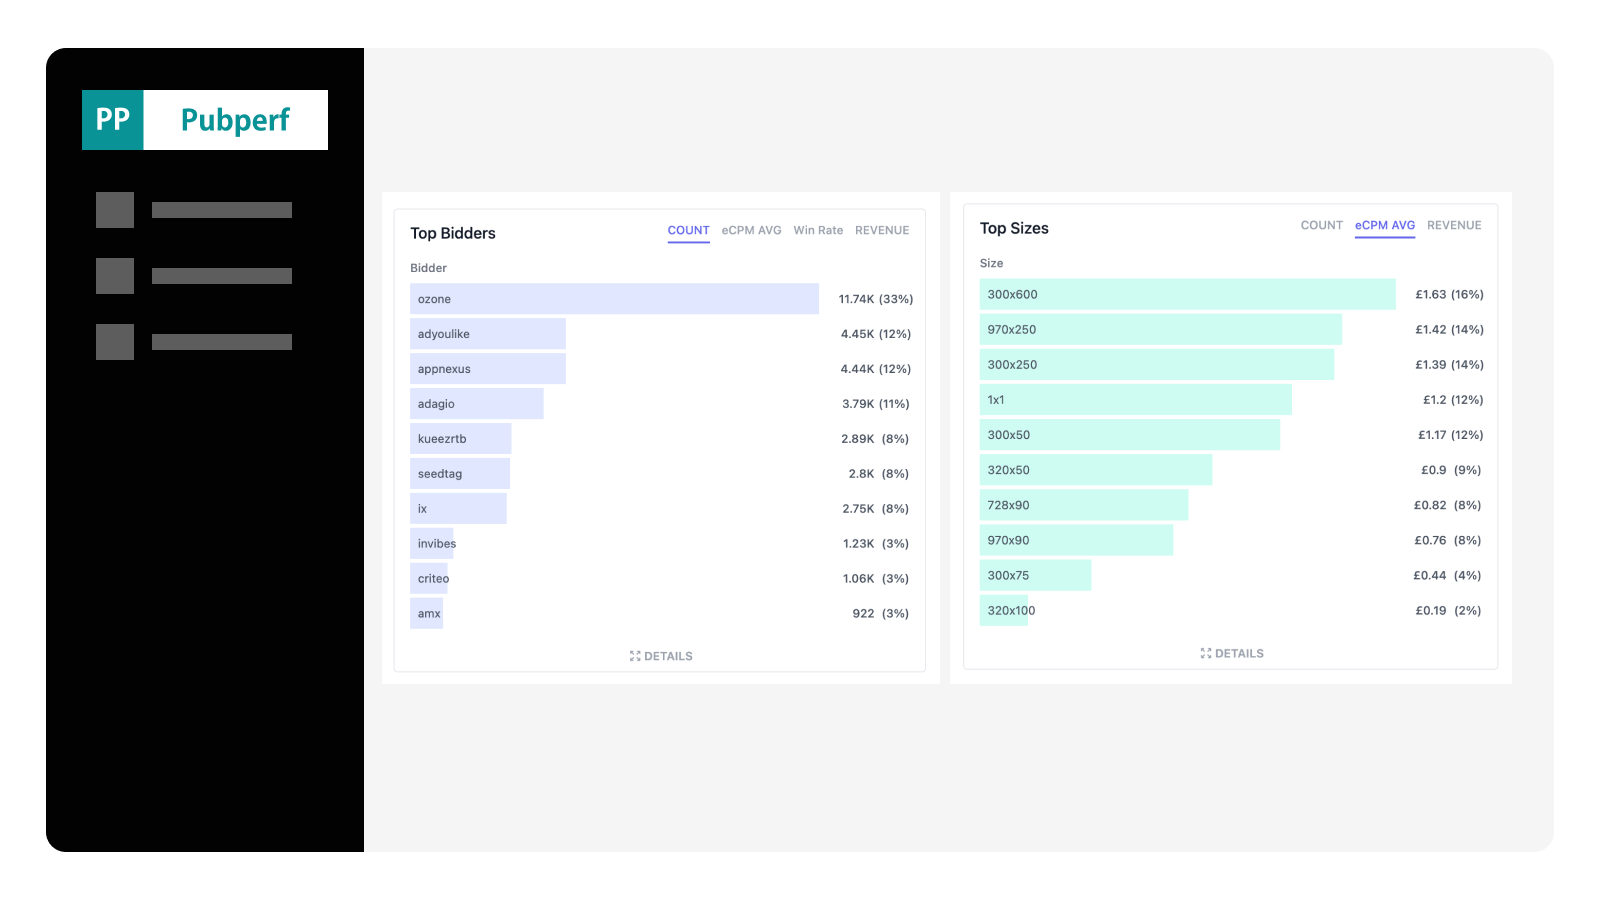
Real-time dashboard with 10-minute granularity. See total impressions, winning impressions by bidder, eCPM trends, timeout rates, and latency data updating in near real-time. When something breaks, you know within minutes — not the next day.
Bidder-level performance tracking. Every metric is available per bidder, so you can compare demand partners side by side: who bids most often, who wins most often, who pays the highest eCPMs, and who causes the most timeouts.
Integrated Core Web Vitals monitoring. Pubperf uniquely combines header bidding analytics with page performance monitoring, so you can see how ad configuration changes affect LCP, CLS, and INP alongside revenue metrics.
Alerting on anomalies. Set thresholds for main metrics and receive notifications when something deviates from your baselines. Catch bidder outages, timeout spikes, and revenue drops before they compound.
Getting Started with Header Bidding Analytics
Step 1: Define Your Baselines
Before making any optimization changes, collect at least two weeks of data to establish what "normal" looks like for your site. Document:
- Average daily revenue by bidder
- Average timeout rate by bidder
- Average bidder latency
- Peak and off-peak traffic patterns
- Day-of-week and time-of-day revenue patterns
Step 2: Set Up Alerts
Once you have baselines, configure alerts for the most impactful anomalies:
- Revenue drop exceeding 20% compared to the same hour last week
- Timeout rate spike above 10% for any bidder
- Bid rate drop below 50% for any bidder that normally bids at 70%+
- New error types appearing in any bidder adapter
Step 3: Establish a Review Cadence
Set a weekly review habit:
- Weekly: Review bidder performance rankings — has anything changed? Are any bidders consistently underperforming?
- Monthly: Evaluate whether your bidder mix needs adjustment — add partners with untapped demand, remove partners that add latency without meaningful revenue contribution
- Quarterly: Audit your timeout settings, floor prices, and ad slot configuration against your analytics data
Conclusion
Header bidding analytics is the difference between guessing and knowing. Publishers who track these metrics systematically — bid rates, win rates, latency, timeouts, eCPMs, and errors — consistently outperform those who rely on ad server reports alone. The data is there in every auction; the question is whether you're capturing and acting on it.
For a comparison of the tools available to help you capture this data, see our Complete Guide to Prebid Analytics Tools.
Get the header bidding visibility you have been missing. Pubperf tracks every auction in real time — bidder latency, winning eCPM, timeouts, errors — all in one dashboard.